$55 an Hour is How Much a Year?
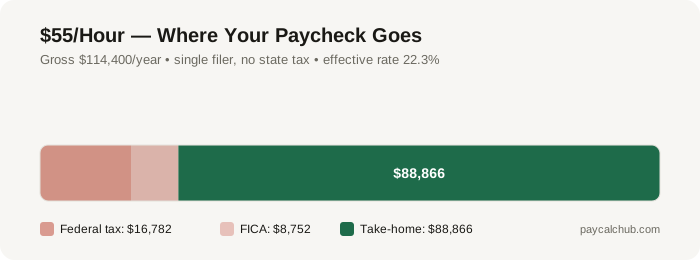
$55/hour × 2,080 hours = $114,400/year before taxes. After federal income tax and FICA, a single filer in a no-tax state takes home approximately $88,866/year ($7,406/month). This guide breaks down every pay period, the W-2 vs 1099 math at this rate, and a realistic monthly budget.
$55 an Hour is How Much a Year?
Working full-time at $55/hour means $114,400 per year before taxes. Here is the full pay period breakdown:
| Hourly | $55 |
| Daily (8 hours) | $440.00 |
| Weekly (40 hours) | $2,200.00 |
| Bi-weekly (80 hours) | $4,400.00 |
| Semi-monthly (twice/month) | $4,766.67 |
| Monthly | $9,533.33 |
| Annual | $114,400 |
$55 an Hour After Taxes
Your actual take-home pay depends on your filing status, state, and deductions. For a single filer with no pre-tax deductions, here is what you keep after federal income tax and FICA:
| Gross annual income | $114,400 |
| Federal income tax (est.) | -$16,782 |
| FICA (Social Security + Medicare) | -$8,752 |
| State income tax (varies) | -$0 to -$11,440 |
| Annual take-home (no state tax) | $88,866 |
| Monthly take-home | $7,406 |
| Bi-weekly take-home | $3,418 |
| Effective federal + FICA rate | 22.3% |
After-Tax Pay by State
State income taxes vary significantly. Here is estimated annual take-home at $55/hr across key states (single filer, standard deduction):
| No state income tax (TX, FL, WA, NV…) | $88,866 |
| Pennsylvania (3.07%) | $85,354 |
| Illinois (4.95%) | $83,203 |
| Georgia (5.49%) | $82,585 |
| New York (est. 5.5%) | $82,574 |
| Virginia (5.75%) | $82,288 |
| California (est. 6.5%) | $81,430 |
Is $55 an Hour a Good Wage?
At $55/hr, you're in the top 20% of US earners. Financial independence and significant wealth-building are realistic goals.
For context, the federal minimum wage is $7.25/hour ($114,400 annualized vs. $15,080 for minimum wage). The US median individual wage is approximately $28/hour ($59,000/year) as of 2026. At $55/hr, you are above the national median.
$55/Hour: Where W-2 and 1099 Paths Diverge
$55/hr ($114,400/year full-time) is a wage point where many workers face a real choice between traditional W-2 employment and 1099 contracting (common in IT, skilled trades, and healthcare specialties). The math isn't simple: 1099 work at $55/hr nets less than it appears once you account for self-employment tax (15.3% vs. the employer covering half under W-2) and the loss of employer-sponsored benefits — often requiring an effective 1099 rate of $65-70/hr to match a $55/hr W-2 offer with good benefits.
Sample Monthly Budget at $55/Hour
Here is a realistic monthly budget for a single adult earning $55/hr (taking home ~$7,406/month, no state tax):
| Monthly take-home | $7,406 |
| Rent (aim for 30% of gross) | $2,860 |
| Groceries + dining | $889 |
| Transportation | $741 |
| Utilities + phone + internet | $518 |
| Health + insurance | $444 |
| Savings + retirement (target 15%) | $1,111 |
| Remaining (discretionary) | $843 |
Is $55/Hour Enough to Live On?
At $55/hour, your monthly take-home is approximately $7,405 (no state tax). This is livable in comfortably in all US markets. Six-figure income provides significant financial flexibility and wealth-building capacity.
Using the standard 30% housing rule, you can afford rent of up to $2,350/month. Here is how $55/hr compares to key benchmarks:
| Federal minimum wage | $7.25/hour · $7.6× minimum wage |
| US national living wage (single adult) | ~$21.18/hour · You earn more |
| US median individual wage | ~$28/hour · 94% above the median |
| MIT Living Wage (avg US city, single adult) | ~$44,000/year · Your income is above this threshold |
Jobs That Pay Around $55/Hour
To contextualize what $55/hr represents in the job market, here are common occupations with median pay near this rate:
| Software engineer (senior) | ~$60/hour · ~$124,800/year |
| Nurse practitioner | ~$60/hour · ~$124,800/year |
| Civil engineer (senior) | ~$55/hour · ~$114,400/year |
| Financial manager | ~$58/hour · ~$120,640/year |
| Data scientist | ~$57/hour · ~$118,560/year |
What $55/Hour Looks Like Over a Career
Assuming 3% annual raises and consistent full-time work:
| Today ($55/hr) | $114,400/year |
| After 3 years (~$59.95/hr) | $124,696/year |
| After 5 years (~$63.8/hr) | $132,704/year |
| After 10 years (~$73.7/hr) | $153,296/year |
At $55/hr ($114,400/year) you're solidly in the top 15% of US earners. Reaching $75–$100/hr typically requires staff-level technical roles, management of 10+ people, or specialized consulting.
Where Does $55/Hour Go Furthest?
The same $55/hr wage delivers dramatically different living standards depending on where you live. The key metric: how many months of rent does your annual net pay cover?
Best Cities for $55/Hour
| Austin, TX | $88,866 net · $1600/mo rent · 55.5 months rent covered · no TX state tax, despite rent increases Austin remains below coastal cities |
| Charlotte, NC | $85,000 net · $1400/mo rent · 60.7 months rent covered · NC 4.75% flat rate, Charlotte's growing finance/tech sector pays well |
| Denver, CO | $84,000 net · $1700/mo rent · 49.4 months rent covered · CO 4.4% flat rate, Denver lifestyle quality high relative to coastal metros |
Toughest Cities at $55/Hour
| San Francisco, CA | $76,000 net · $3200/mo rent · 23.8 months rent covered · CA state tax on $114,400 hits 9.3%+ effective rate; SF housing costs extreme |
| New York City, NY | $74,000 net · $2800/mo rent · 26.4 months rent covered · NYC combined marginal rate at $114,400 exceeds 40% including all taxes |
| Honolulu, HI | $73,000 net · $2500/mo rent · 29.2 months rent covered · HI's 8.25% top rate and island premium costs reduce $55/hr purchasing power |
At $55/hr ($114,400/year), you're in the top 15% of US earners. The choice of state now has a dramatic impact: the same income yields $14,000–$18,000 more per year after tax in TX or FL vs. CA or NY.